![[object Object]](/static/SBI-new-3f05b8e8a65d5a738bcbf2b4b08ae8c3.svg)
![[object Object]](/static/HDFC-new-bbc46138c322f4e8beb5ef76c57a6aff.svg)


 All Tech Blogs
Mobile
All Tech Blogs


If you read our previous blog, we deep dive into how we optimized the chat experience performance via DB queries, protoBuf, and pagination. Those efforts collectively improved latency by ~20%.
In the second part of the blog series, we shift our focus to CPU profiling and thread utilization. We will cover how analyzing thread consumption in a flow can help in identifying thread bottlenecks and further improve performance. These efforts led to an additional ~30% improvement.
What is a CPU Profiler? From androids official site, “You can use the CPU Profiler to inspect your app’s CPU usage and thread activity in real time while interacting with your app, or you can inspect the details in recorded method traces, function traces, and system traces.”
There are 100s of threads initialized in our app. Many are short-lived and don’t need deep analysis. Of the long-lived threads, the main thread is crucial because that blocks UI and interaction. The database threads are also crucial because so much of the app depends on data.
We analyzed the main thread utilization during the chat flow, and learned the following:
We have compiled a list of all such improvements in the Profiling the Main Thread section.
We also analyzed our DB threads. We hadn’t configured the DB executors or thread pool and were using a single shared pool with default executors and configuration for all our databases. We also found a separate use case (paging) that was sharing the DB executor. This is covered in depth in the Database Executors and Threads section.
Using a CPU profiler we analyzed the main thread during our flow. We found many inefficiencies.
1. Using ‘setValue’ instead of ‘postValue’: At many places we used LiveData `post` unnecessarily to publish data from our viewModels to the UI. We use MutableLiveData, and were using the `postValue()` api at many places. This api internally calls `Handler.post()` which increases the latency. If you use ‘setValue()’ api instead, it will directly notify your view observer and hence is relatively faster. Same goes for VMAction, ‘performAction’ vs ‘performActionNow’.
2. Using android view stubs: Chat fragment consists of multiple child fragments. One of the fragments is ChatInputWidget. Using profiler, we saw that the view for this fragment takes time to inflate. The Xml for this view is quite complex. After checking xml we observed that one particular child view was only required in a few cases and need not be inflated every time. We extracted it into a separate xml and added a view stub in the original layout. We now render this view only on a requirement basis and this helps in reducing the overall inflation time.
3. Optimizing child fragments attachment logic: We changed the logic of attaching child fragments in chat. We observed in the profiler that child fragments start getting attached after a particular event was triggered from the chat viewmodel. We initially fetched the meta data either from DB or network and depending on the data we attached child fragments. Fetching data and taking action on it takes time. We realized that we could actually attach the child fragments directly and update their UI state later. This change helped us in rendering the UI faster.
4. Lazily injecting dependencies in viewModel: While viewModel creation, time was getting consumed in instantiating viewModel dependencies. Many of these dependencies are not required in `init` of the viewModel. We wrapped such dependency with dagger.lazy and saved a few milliseconds.
5. Reducing number of coroutines launches: At a few places we initialized coroutines unnecessarily. We could have used `withContext` api but we launched new coroutines which are a bit costly compared to `withContext`. This again was visible in the profiler and we removed such unnecessary launches.
6. Creating a single class having all config variables: In chat we use a lot of config variables. We were fetching most of these variables in the viewModel ‘init’ itself. All these variables were getting fetched individually one by one from shared pref. Whenever we fetch any variable from config a thread switch happens and thus impacts the performance. To fix this we created a custom class and defined all variables as members of this class. We used this class in our viewModel directly and avoided thread switching happening multiple times.
7. Metadata optimisation: As mentioned in point 3 that we first fetch chat meta either from database or network. We use this meta data to load chat messages from DB. Fetching metadata first and passing it to the class which loads messages was taking a few hundred Ms. We checked with the product and found out that in 60% of the scenarios a user lands on a chat thread from the chat roster screen itself. And guess what, we have meta data available on the previous screen. We refactored our code and passed this meta as an input to the chat view. Now the dependent class doesn’t need to wait and can start fetching messages from DB as soon as the view gets initialized. This was kind of a silver lining in chat cases where 60% of users are selecting chat threads from chat roster. You would need to dig into your product and look for such optimisations.
In our application we have many databases. All these databases are independent of each other. There are multiple queries being fired in parallel on each database throughout the application. Apart from normal CRUD operation, at multiple places we also subscribe to changes in tables using flows.
Internally a database uses two different thread executors, one is called `Query` executor and second one is `Transaction` executor. If you are using suspended functions in your DAO then you can directly call these methods from your UI scope. Database will use these executors to execute your query on an IO thread internally.
1. Query executor is used for performing only read operations, it can run multiple threads at a time in parallel.
2. While a transaction executor is used for executing write queries like Insert, Delete, Update. Transaction executor can run only one query at a time. Also when a transaction is happening, no read operations are allowed.
When we create an instance of a database we have the option to pass our own executors for both query and transaction. However in our current implementation we don’t pass any executor. When nothing is provided then a default executor, ArchTaskExecutor, is being used internally.
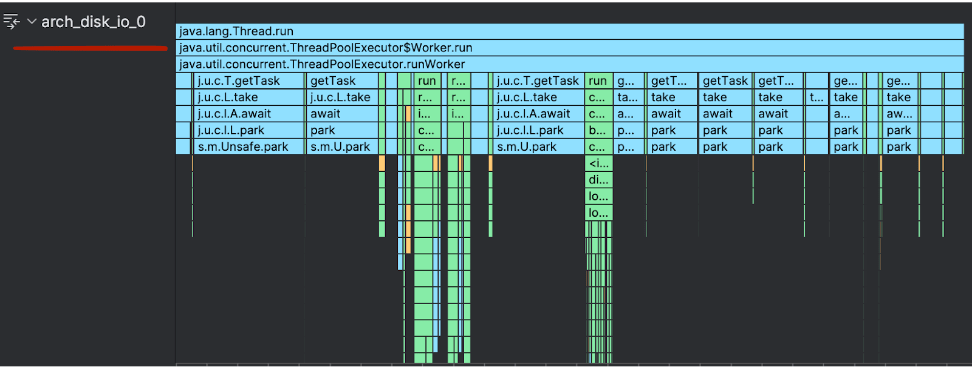
ArchTaskExecutor serves as a common executor, used by multiple android libraries to execute tasks and is based on a singleton pattern. If you check the cpu profiler, you will see exactly four threads with the prefix `arch_disk_io_`. These threads belong to `ArchTaskExecutor`.
It turned out that all the databases in the application are using the same ArchTaskExecutor for executing tasks, with the default thread pool (with 4 threads). The same four threads are being used by all databases to execute suspended CRUD operations and even flow subscriptions.
This was a simple bottleneck, and we changed our core database to use a separate thread pool. After doing a POC we figured that 4 threads were enough for the thread pool.
Apart from the database there is one other library as well which uses the same `ArchTaskExecutor`, the Paging Library. In chat we use a paging library in both chat roster view and chat message view which load chats and messages respectively. Again at both places while defining the paging config we didn’t pass any separate executor and we ended up using the same executor. We now have defined a single thread executor separately in our paging config.
In this blog we covered:
1. How to use a CPU profiler to understand bottlenecks and areas of improvement in your flow.
2. A list of improvements that we did w.r.t our Main thread in the chat flow.
3. How to understand the DB threads and executors and find optimizations.
4. How to separate consumers of the DB thread executor (e.g. pagination library)
We have more ideas to optimize this flow (AsyncLayoutInflater for fast rendering and changing our DB design to optimize queries). You may see a part 3 soon!
The changes from the previous post and this post have brought down the chat page load time (P90) from ~1.5s (in July 2023) to ~750 ms (in April 2024), ~50% improvement!
Hopefully these blogs provide valuable insights for your own optimization endeavors.