Engineering
Rollup: Managing 300 Billion Daily Metrics at PhonePe
Robin Tak02 July, 2024
Have you ever experienced an abrupt service shutdown in production due to the inability to monitor CPU utilization and memory spikes post-deployment? If so, you understand the critical importance of service metrics monitoring.
At PhonePe, we empower our engineers to proactively monitor their applications post-deployment, during upgrades, and migrations by using Grafana, built on top of our Metrics platform. This approach ensures that they can proactively identify and address any anomalies in the system.
Anomaly detection in metrics is like a smoke detector in a building. It constantly monitors for signs of trouble (unusual metrics), sounding the alarm to alert engineers before a small issue turns into a major incident.
In this blog post, we will explore how PhonePe’s Metrics Platform enables real-time service monitoring, highlighting the use of advanced Rollup techniques to efficiently manage and display vast volumes of time-series data.
Metrics Overview
The Metrics Platform enables our engineers to monitor their services 24/7. This platform stores and serves the data that powers Grafana dashboards and the alerting infrastructure(Anomaly Detection). All metrics are stored as time series data in OpenTSDB, a well-established project in the open-source domain.
Scale
- Ingestion rate: ~3.8 Million/sec (Peak: ~5 Million/sec)
- Volume ingested per day: ~2.54 TB per day
- Query rate : ~140 OpenTSDB queries (~200k peak HBase reads per second)
- HBase Region Servers: 49
- Cluster Size: ~1.65 Petabytes
Metrics Architecture

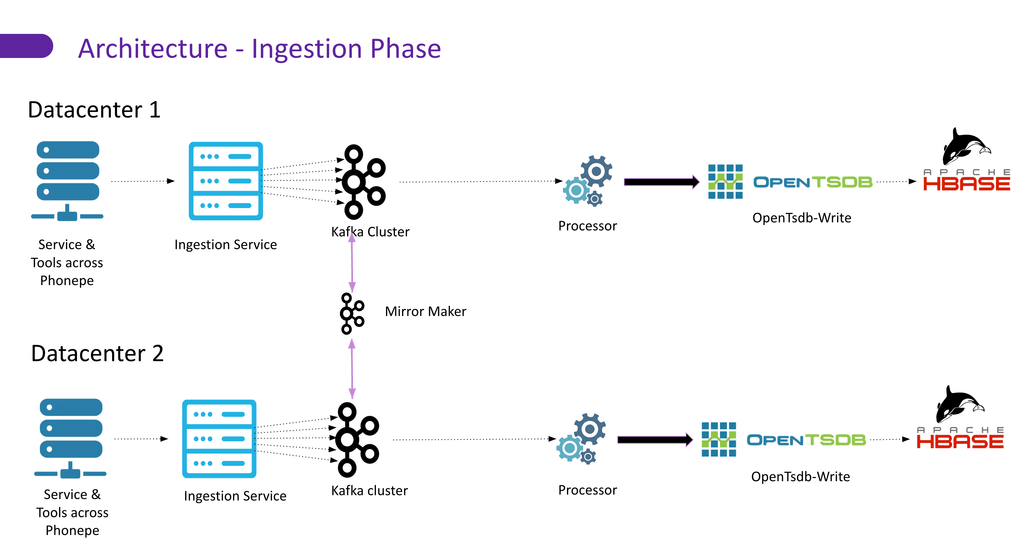
All services across PhonePe publish data to a Kafka Cluster through an ingestion service. Processors consume the data from Kafka and publish it into HBase through OpenTSDB. For redundancy, we leverage Kafka Mirror Maker to replicate data across two data centers, which run independently.

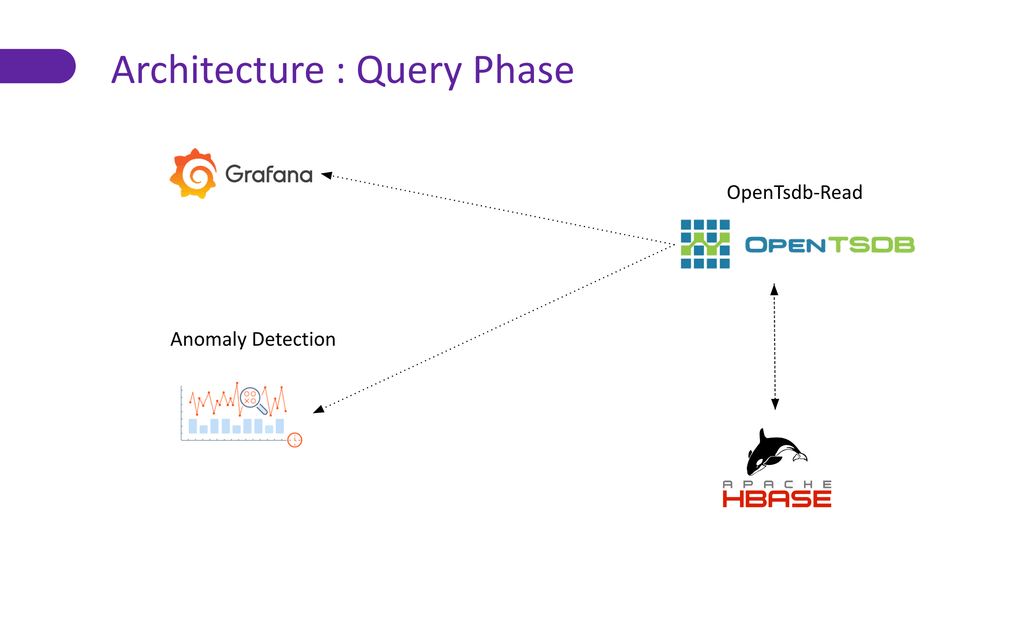
Anomaly Detection and Grafana Dashboards allow users to query, identify anomalies, and monitor their data published to OpenTSDB.
How does OpenTSDB leverage HBase?
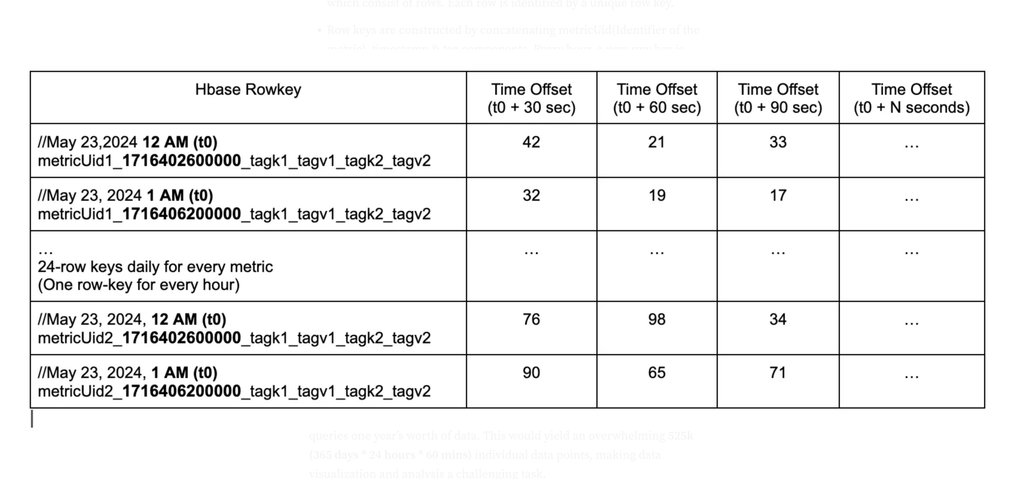
HBase is a wide-column, distributed, scalable big data store modeled after Google’s Big Table, designed to handle large tables with billions of rows and millions of columns. It organizes data into tables consisting of rows identified by unique row keys. These keys are constructed by concatenating ‘metricUid’ (Identifier of the metric), timestamp, and tag components, allowing fast scans over a metric due to their contiguous, lexicographically sorted nature.
Representation of the data in HBase:

The Problem Statement
In the realm of monitoring and data analysis, efficiently managing vast amounts of time-series data is crucial. As data volume grows with time, storing high-resolution data and querying it becomes increasingly challenging. Phonepe’s Metrics platform addresses these challenges through a feature known as ‘Rollup’.
Rollup
Rollup is the process of aggregating time-series data over specified intervals. Think of Rollup as weather summaries. Rather than checking every minute-by-minute temperature reading, you record the daily highs and lows, capturing the overall trends without getting bogged down by too much data.
Consider a scenario where a metric is recorded every minute, and the user queries one year’s worth of data. This would yield an overwhelming 525k (365 days * 24 hours * 60 mins) individual data points, making data visualization and analysis a challenging task.
Rollup resolves this issue by allowing users to work with lower-resolution data, such as hourly data, which reduces the number of data points to a more manageable number of 8,760 (365 days * 24 hours). With this lower-resolution data, anomalies can be identified, and if necessary, users can drill down to finer-resolution data (e.g., 1-minute intervals).
Need for Rollup in Metrics Platform
The Metrics Platform adds ~330 Billion metrics and ~2.54 Terabytes of data in the OpenTSDB database daily. This growing data volume creates challenges in data storage, necessitating constant hardware expansion and resulting in slower query responses.
As Rollup data keeps lower resolution data, the number of data points decreases by a factor of N (Rollup Interval). Rollup provides several key advantages:
- Faster Query and Improved Performance: Rollup enables significantly faster queries over larger periods, enhancing the platform’s performance.
- Space Savings: Reduces data storage requirements significantly by aggregating data.
Technical Deep Dive
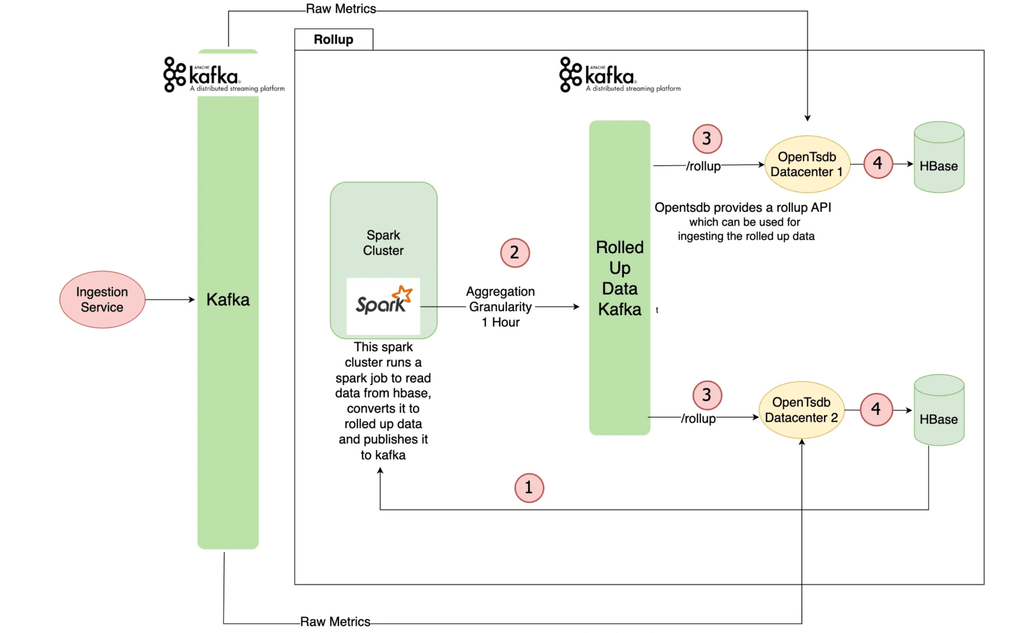
Implementing Metrics Rollup involves a Spark job running on HBase raw data daily. The aggregated data is ingested into Kafka and flows back into HBase.
The technical architecture includes:

- Step 1: Spark Cluster runs a spark job to scan data from HBase. Scan request takes the start and end times and can be provided dynamically. For this duration, all metrics published to Hbase via OpenTSDB are queried.
- Step 2: Scanned metrics are rolled up hourly by downsampling and then published to the Kafka Cluster. For redundancy, Kafka has a mirror maker setup, this data gets replicated across multiple Data Centers.
- Step 3: Kafka Processors consume rolled-up data from the Kafka cluster and call Rollup API (Provided by OpenTSDB).
- Step 4: Rolled-up data is published to OpenTSDB in different tables. While querying, data is fetched from raw or rolled-up tables (Split Query is at play here — explained in the next section)
As mentioned previously, both data centers are completely independent and consume data from Kafka topics replicated across. Eventually, both OpenTSDB clusters will have the same data. The rolled-up data is retained indefinitely, while raw data can be kept for a smaller configured duration.
Challenges During Rollup
Maintaining High Ingestion Rate
Running Spark Job along with the day-to-day metrics processing was a huge challenge as Rollup Spark Job scans days of data and that impacts the HBase cluster performance. After trying multiple patterns with running scans on the live tables, we pivoted to using Table Snapshots instead of Live Tables. This gave us a significant benefit as running hbase scans on table snapshots did not have a high impact compared to the impact on live tables. Spark Job reading from Table Snapshot was ~7 times faster than the live table as it reads data from static HFiles.
Split Query to the rescue for delayed Rollups
Dealing with postponed rollups poses a significant disadvantage because the data is only available in the rollup table after a day of ingestion since our Spark Job runs daily.
Consider a scenario where a user queries data from the past three days. Since the Rollup Spark job for the previous day’s data has not yet been triggered, only the first two days of data are available in the rollup table.
To address this, OpenTSDB can be configured with a Rollup SLA of three days. This configuration allows the system to split the query into a Rollup Query and a Raw Query.
First, the Rollup Query is executed to fetch data from the start time (‘startTime’) of the query up to the last available rollup time.
Next, the Raw Query is executed from the last rollup time to the end time (‘endTime’) to fetch the remaining data from the raw table, since rollup data for this period has not yet been processed.
In this manner, we can benefit from using rolled-up data and making the split invisible to the users. Grafana dashboards and alerts configured by the users remain unchanged and query performance is enhanced as query response is partially fetching rolled-up data (lesser data points).
Result
Daily spark rollup job takes ~3 hours to complete. While we could add more executors to speed up the process, we maintain this scale to avoid overwhelming Kafka, which could impact our live topic ingestions.
Query Performance Improvement
Queries fetching data from rolled-up metrics are ~10x faster compared to those fetching raw data. Additionally, long-running queries that previously timed out now execute seamlessly, enhancing the overall performance and reliability of our monitoring system.
Storage Reduction
Rolled-up data takes less space than raw data, as it keeps data points at an hourly level instead of every minute granularity, providing huge benefits in terms of space. One day of raw data (~2.54 Terabytes) is rolled up into approximately 40 Gigabytes of data.This represents a space-saving of roughly 1/64th compared to raw data.
Conclusion
Metrics Rollup in OpenTSDB is a significant step forward in managing time-series data efficiently, particularly at a large scale. By addressing the challenges of data storage and querying, Rollup offers considerable space savings and enhanced query performance. As data volumes grow, Metrics Rollup ensures that historical data remains accessible and valuable for monitoring, analytics, and decision-making. By optimizing our infrastructure, this innovation allows our engineers to deliver a seamless and reliable experience for millions of PhonePe users.