Architecture
Managing Elasticsearch at scale at PhonePe — Part 1
Nitish Goyal30 May, 2024
Real time analytics platform at PhonePe handles more than 100 billion events a day. We store this data for approximately 30 days which is equivalent to almost 3 trillion events in the Elasticsearch cluster.
In this article, we will discuss how we have scaled our cluster to handle millions of writes per second
Architecture — Analytic Platform

Analytics services read it from the Kafka, index the document into Elasticsearch and writes the doc into HBase. We maintain indexes in Elasticsearch and documents in HBase.
Majority of the analytics queries return results from Elasticsearch directly.
In case, when clients need to see raw documents, we execute the query in Elasticsearch, fetch the IDs and fetch documents corresponding to those IDs from HBase.
Elasticsearch Cluster Configuration

Enough talking, let’s get to the scaling bit
Below are certain strategies we have used over time to scale throughput on our clusters
1. Improve skewness in the cluster — Distribute equal load across nodes of the cluster
i) Custom shared rebalancing algorithm
To better manage our cluster, we create daily indices as most of our queries are usually on recent data. This reduces the search span of the query. Additionally, it allows us to control the TTL (time to live) of various indices for each of the clients of the analytics platform.
Elasticsearch by default balances shards across all nodes of the cluster without taking into consideration daily indices. It distributes equal shards of all previous day indices to all nodes. This at times creates skewness where certain nodes in the cluster get more hot shards (shards of the current day indices) resulting in uneven write load on the nodes.
To overcome this challenge, we run our custom job which distribute hot shards equally across all nodes.
We take total count of shards across indices for the current day, calculate the average shards per node. We move shards from nodes which have more than average shards to nodes which have shards less than average using the priority queue. Shards first gets moved from node with highest count to node with lowest count. This ensures all the nodes have exactly the same number of hots shards on any given day.
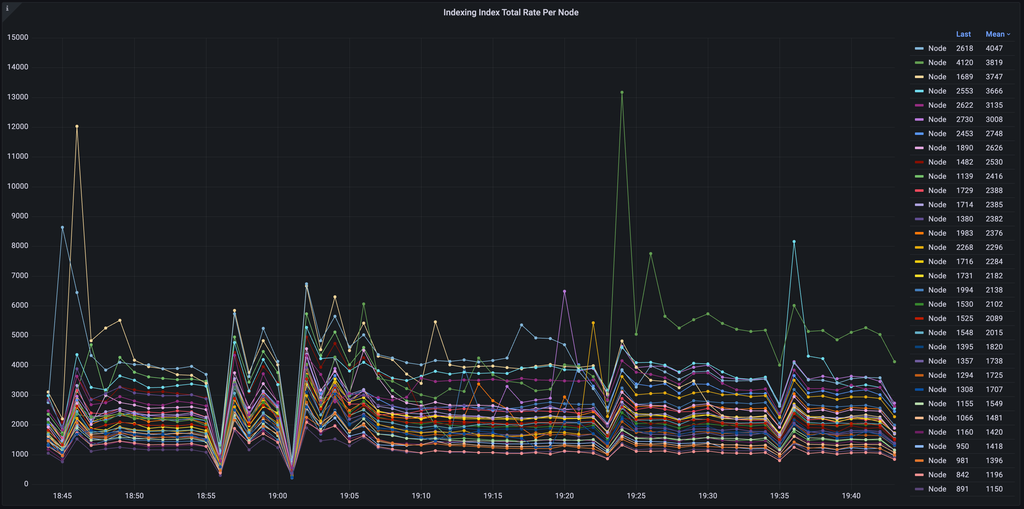
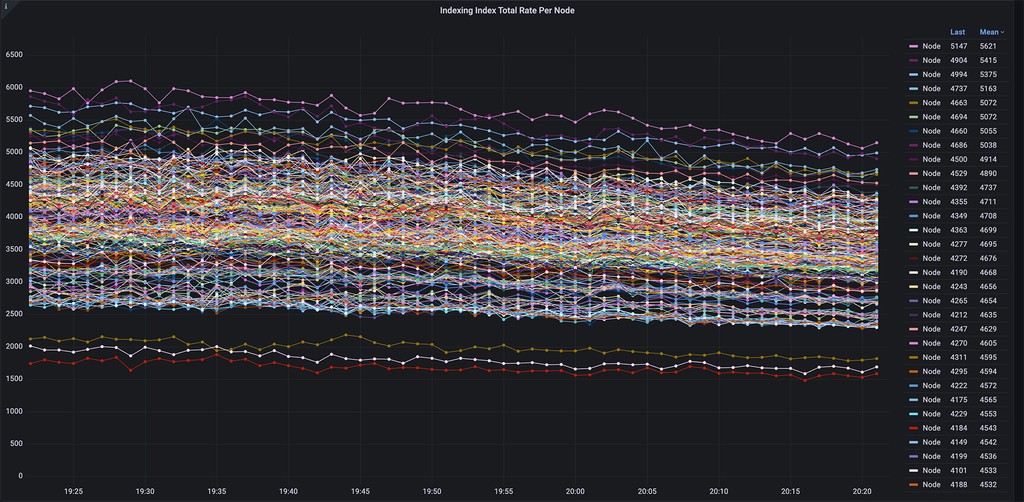
You can see in the below images. We were earlier having skewness as high as 4x. After the above changes, skewness has come down drastically. We are constantly working on improving our algorithm along with other cluster configurations to bridge that gap to make the write throughput exactly similar across all of our nodes.


ii) Shard size tuning
Elasticsearch recommends to keep the shard size somewhere in the range of 20GB to 50GB. Ours is a mostly write heavy system (90% writes and 10% reads). We have run quite a few experiments based on our workload and we have identified the ideal size which works for us is somewhere close to 15 GB to 20 GB. This helps us having more number of hot shards for better parallelism and more number of hot shards help in further reducing the skewness in the cluster. We try to ensure to have hot shards per node to be at least equal to half the number of cores on a node.
iii) Custom shard count tuning algorithm
As index creation is a slightly heavy process. We earlier used to let the index creation happen at run time during the midnight as newer documents arrive. Over time, this has led to minor degradation in the performance for few minutes around the midnight. To overcome this challenge, we pre create the indices for next day in staggered manner the previous day.
As PhonePe is a growing company, the volume of data in each index, keeps on increasing. We observed that over time, we used to end up having bigger shard sizes. Our alerts used to kick in as soon as the shard size crosses 40 GB for a particular day.
To overcome this, we take the max of last n days of data ingested into an index and use that volume to find the ideal number of shards for an index for the next day. This ensures the number of shards keep on rebalancing for the optimal performance and the amount of data in each shard remains somewhere in the range of 15GB to 20GB.
iv) Equal shards per node for an index
Some of our clients are heavy hitters which ingest a lot of data. Although the above approach in step 3 ensures that write throughput for a day is almost similar as most of the shards in the cluster are of almost equal size.
We still adopt one more strategy to set a configuration of max_shards_per_node for an index to some single digit value x which ensures no more than x shards are present on a single node for an index. In our production cluster, this setting is set to 2.
2. Improve fan out from Elasticsearch client to the Elasticsearch server
One fine day, we observed one peculiar thing that fan out of each of our write query was too high. Each ingest node used to fan out each write request to 100+ data nodes which results into smaller batch writes of a few KBs on each data node.
To tackle this, we have written another custom algorithm for routing the requests from elasticsearch client to the server. We divide the number of shards of an index into a virtual shard count and then allocate some x virtual shards to each of our Kafka partition.
For example, an index idx with 200 shards gets mapped to 1000 virtual shards. Data into this index is getting ingested from a Kafka topic with let’s say 120 partitions. Now each of the partition gets mapped to average 1000/120 = 8 shards. Reads from one Kafka partition are now being sent to 8 virtual shards which in the background are tied to only a couple of nodes. This ensured that each of the batch write happening on a shard of an index increased from few KBs to few MBs for optimal throughout.
3. Block expensive queries
At times, we have seen in the past few heavy grouping queries on the fields with very high cardinality used to slow down the entire cluster which subsequently used to slow down the write and read throughput.
To tackle this, we have built our custom query blocking algorithm which predicts the total cardinality values a query is going to hit and accordingly blocks the query. More details on that can be found here.
Conclusion
With the changes mentioned above, we have been able to increase our cluster throughput almost 3x.
Earlier each of our data node used to handle only upto 5k writes per sec. Now, each node can easily handle upto 15k writes per sec.
We hope to continue investing our time to further increase the throughput per node of the cluster.
In the next part of this article, I will talk more about on our cluster configuration and various settings we have tuned for optimal performance of the cluster.